Page 14 - Moreno Valley City Manager's Report for 2022
P. 14

JAN-22      FEB-22  MAR-22                     APR-22  MAY-22  JUN-22            JUL-22  AUG-22  SEP-22  OCT-22  NOV-22  DEC-22                   TOTAL
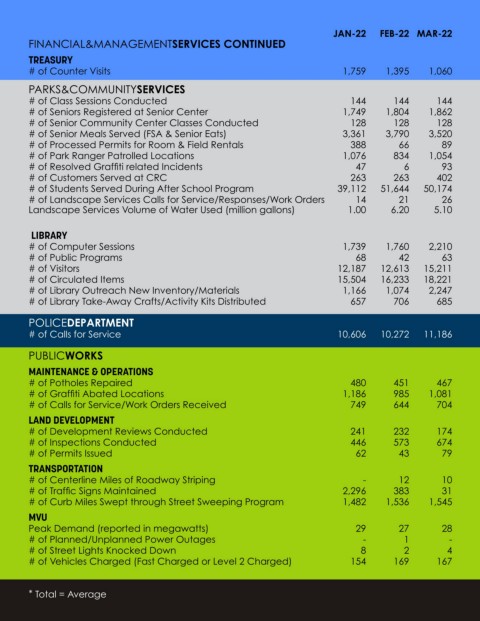
        FINANCIAL&MANAGEMENTSERVICES CONTINUED
        TREASURY
        # of Counter Visits                                                              1,759      1,395      1,060                      832        852       919         800        833       816        928        901       878    11,973

        PARKS&COMMUNITYSERVICES
        # of Class Sessions Conducted                                                      144        144        144                      104        100       104         103        101       100         94         97         94     1,329
        # of Seniors Registered at Senior Center                                         1,749      1,804      1,862                    1,927      2,001     2,066       2,144      2,179     2,269      2,327      2,399     2,438    25,165
        # of Senior Community Center Classes Conducted                                     128        128        128                      128        128       128         128        128       128        128        128       128      1,536
        # of Senior Meals Served (FSA & Senior Eats)                                     3,361      3,790      3,520                    3,107      3,721     3,669       3,466      3,636     3,459      3,542      3,536     3,349    42,156
        # of Processed Permits for Room & Field Rentals                                    388         66         89                      181        189       744         575         59        92        116        571       776      3,846
        # of Park Ranger Patrolled Locations                                              1,076       834      1,054                      947      1,332     1,247       1,471      1,480     1,406      1,629      1,480           -     13,956
        # of Resolved Graffiti related Incidents                                             47         6         93                       68         77         49         66         36        40         39         32          7       560
        # of Customers Served at CRC                                                       263        263        402                      505        542       644         569        417       633        558        414         16     5,226
        # of Students Served During After School Program                                39,112    51,644    50,174                    61,511    63,952    14,992           513    37,458    83,852    89,598    62,174    49,063   604,043
        # of Landscape Services Calls for Service/Responses/Work Orders                     14         21         26                       20         15         29         55         49        43         29         16         16       333
        Landscape Services Volume of Water Used (million gallons)                         1.00       6.20       5.10                     8.96       9.35     10.62       16.10      16.10     19.10         15          7          5       120


         LIBRARY
        # of Computer Sessions                                                           1,739      1,760      2,210                    2,006      1,775     2,145       1,996      2,235     2,021      1,945      1,537     1,576    22,945
        # of Public Programs                                                                68         42         63                       61         66         50         75         49        74         84         71         50       753
        # of Visitors                                                                   12,187    12,613    15,211                    15,679    15,103    17,761    28,583    17,366    17,486    17,464    25,182    33,654   228,289
        # of Circulated Items                                                           15,504    16,233    18,221                    19,102    19,270    21,077    24,136    21,301    19,893    23,622    19,067    16,787   234,213
        # of Library Outreach New Inventory/Materials                                    1,166      1,074      2,247                    1,178      1,350     1,452         471        739       551        923        576       515    12,242
        # of Library Take-Away Crafts/Activity Kits Distributed                            657        706        685                    1,142      1,042       659       1,806        459       759        601        751       484      9,751

        POLICEDEPARTMENT
        # of Calls for Service                                                          10,606    10,272    11,186                    10,792    11,686    10,967         9,977    10,684    10,964    12,140    11,051    11,191   120,325


        PUBLICWORKS
        MAINTENANCE & OPERATIONS
        # of Potholes Repaired                                                             480        451        467                      301        383       403         331        365       296        289        236       210      4,212
        # of Graffiti Abated Locations                                                   1,186        985      1,081                    1,378        999       907       1,133        773       844      1,070      1,027       641    12,024
        # of Calls for Service/Work Orders Received                                         749       644        704                      677        583       730         649        571       437        553        416       340      7,053
        LAND DEVELOPMENT
        # of Development Reviews Conducted                                                 241        232        174                      451        519       314         284        293       347        355        467       388      4,065
        # of Inspections Conducted                                                         446        573        674                      495        624       745         640        957       669        544        371       476      7,214
        # of Permits Issued                                                                  62        43         79                       52        100       118          76         81        92         78         53         69       903

        TRANSPORTATION
        # of Centerline Miles of Roadway Striping                                              -       12         10                       17         24         80         26         28        26         91           -          -       314
        # of Traffic Signs Maintained                                                     2,296       383         31                      407        451       229         301        306       379        291        385       465      5,924
        # of Curb Miles Swept through Street Sweeping Program                             1,482     1,536      1,545                    1,560      1,520     1,560       1,566      1,452     2,260      1,860      1,800     1,650    19,791

        MVU
        Peak Demand (reported in megawatts)                                                 29         27         28                       31         36         36         50         48        54         59         41         28     38.94
        # of Planned/Unplanned Power Outages                                                   -        1           -                        -          -          -          -          -         2         2          1           -         6
        # of Street Lights Knocked Down                                                       8         2          4                        1           4         1           -         1          3         3          2          3        32
        # of Vehicles Charged (Fast Charged or Level 2 Charged)                            154        169        167                      199        220       228         238        204       217        223        251       190      2,460


        * Total = Average
   9   10   11   12   13   14   15   16